Cost
Total €198
Cost/ha €0.56 cents/ha
These costs include:
Results
Table 4.5: Deadwood data in Pilot zone. (Source NFI 2005)
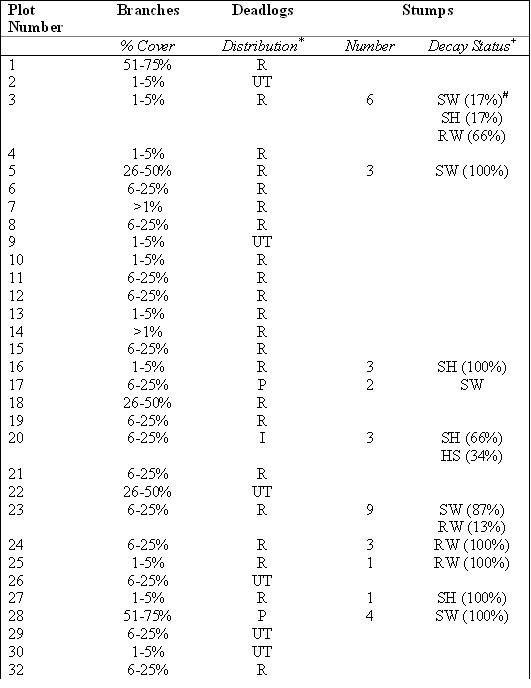
* I = Deadwood Islands, P = Deadwood Piles, R = Deadwood Randomly Distributed,
UT = Deadwood Under Threshold Diameter (i.e. 7cm)
+ SW = Solid Wood, SH = Rotten Sapwood / Solid Heartwood, HS = Rotten Heartwood / Solid Sapwood, RW = Rotten Wood
# Percentage of stumps listed under each decay class
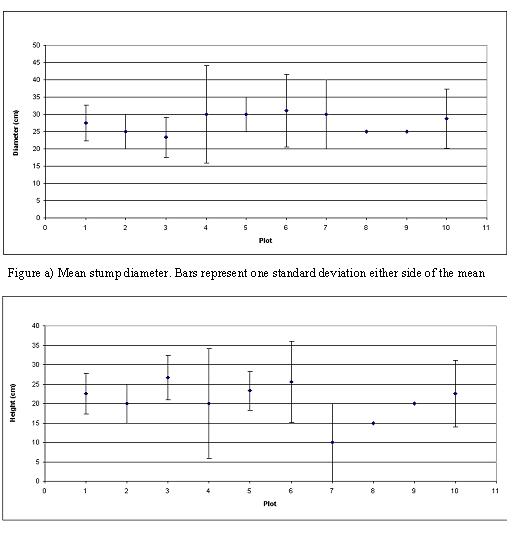
Figure b) Mean stump height. Bars represent one standard deviation either side of the mean
Remarks
Approximately 46% of the NFI plots in the pilot zone recorded deadwood. All of these plots were in stands over 14 years old (i.e. all planted prior to 1990). Additionally 71% of those plots recording deadwood were found in State Forests. It was found that the NFI data provided substantial information about the type and distribution of deadwood in the plots. Branchwood cover was found mostly ranging between 1-5% (32% of the plots) and between 6 – 25% (45% of the plots). The distribution of deadlogs over the reporting threshold value of 7cm diameter was primarily random (88% of the plots). For stumps over the reporting threshold of 20cm diameter a stump height and diameter is recorded (Figures a and b) as well as a decay status.
Problems and improvements
Remarks and Conclusions
This information would be very useful in combination with volume models and research to link decay status to density to develop carbon stocks on this pool.

A community initiative ERDF
INTERREG the IIIB Atlantic Area