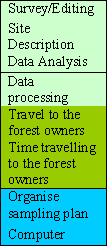
Cost
Total cost €5765
Shared Cost €3534
Marginal Cost €2231
Total Cost/ha €0.16
These cost include:
Results
Figure 6.5a: Classified by job characteristic:
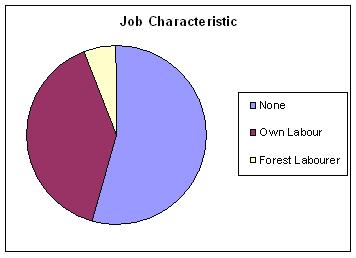
Figure 6.5b: Classified by labour input:
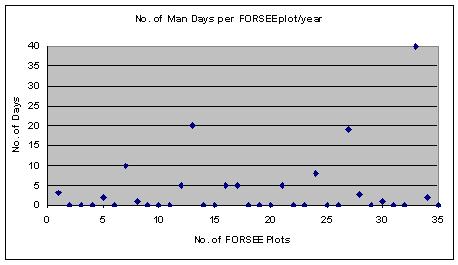
Figure 6.5c: Classified by gender:
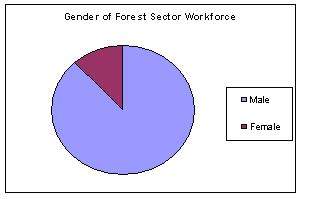
Figure 6.5d: Classified by age:
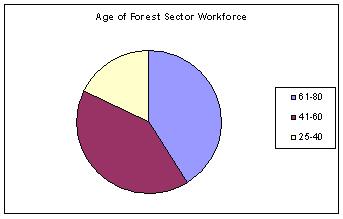
Figure 6.5e: Age of the Forest Sector Workforce
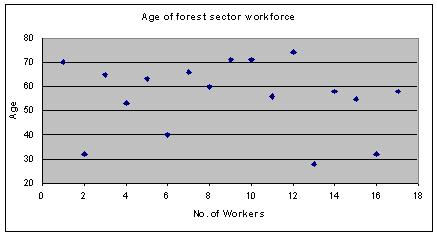
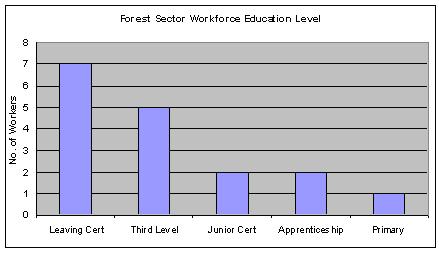
Figure 6.5f: Forest sector workforce classified by education:
Remarks
Results from the forest owner survey show that >50% of the sites had no labour input (figure 6.5a). The majority of the labour input was by the forest owners own labour and on 3 of the forest sites work was by a forest labourer. Two of these 3 forest sites are in a management contract with a forestry contractor company and therefore the forest labourer was employed as part of the management contract and not by the forest owner. The breakdown of labour input (figure 6.5b) shows that 20 of the 35 forest owners had no labour input in their forests and that 10 forest owners had 5 or less man days in the forest.
The forest sector workforce from the forest owner survey was 88% male and 12% female (figure 6.5c). The female workers were also the forest owners.
Results from the forest owner survey on the age of the forest sector workforce on work completed in the FORSEE forest owners sites show that 76% of the workers (forest owners and forest workers) were greater than 50 years (figure 6.5e). 35% were greater than the retirement age (65) and 24% were over 70 years. The age classes 41-60 and 61-80 both accounted for 41% of the forest workforce respectively (figure 6.5d). These results would indicate that the workforce is quite old but it should be considered that results from the survey showed that in all instances where the forest workforce was greater than 50 years it was because the work was carried out by the forest owner. Accordingly the age of the forest workers reflects broadly the age profile of landowners in the area.
The educational level (figure 6.5f) of the forest workforce showed that 76% had completed secondary level education and of the 76%, 29% had completed third level education.
Problems and Improvements
The job characteristic, age, gender and education level is reflective only of work carried out on the FORSEE forest owners sites and therefore only reflects the forest sector workforce on a local scale. This would not be an accurate representation of the forest sector workforce in the pilot zone.
National data on forest sector workforce statistics does not exist as forestry is grouped with agriculture for CSO (Central Statistics Office) statistics and results separated for forestry are unavailable.
Conclusions
While > 50% of the sites had no labour input this does not necessarily mean that these sites showed a poor standard of maintenance. As previously outlined (indicator 6.3), little maintenance is required between the end of the establishment contract (years 4-5) and 1st thinning, which has yet to be carried out on all forests in the survey with the exception of one forest.

Initiative Communaitaire FEDER
INTERREG IIIB Espace Atlantique