Sousa Valley (1995): 34 668 ha
Forest area mapped (1995):
4956,1 ha
Percentage of the total forest
area in Sousa Valley: 14,3 %
Cost
TOTAL COST: 5675€
Costs/ha: 1,14 €
The total cost includes :
1- Data collection 5000 €
2- Data analysis 675 €
Results
Forest area in 1995, mapped according to FAO land use classification
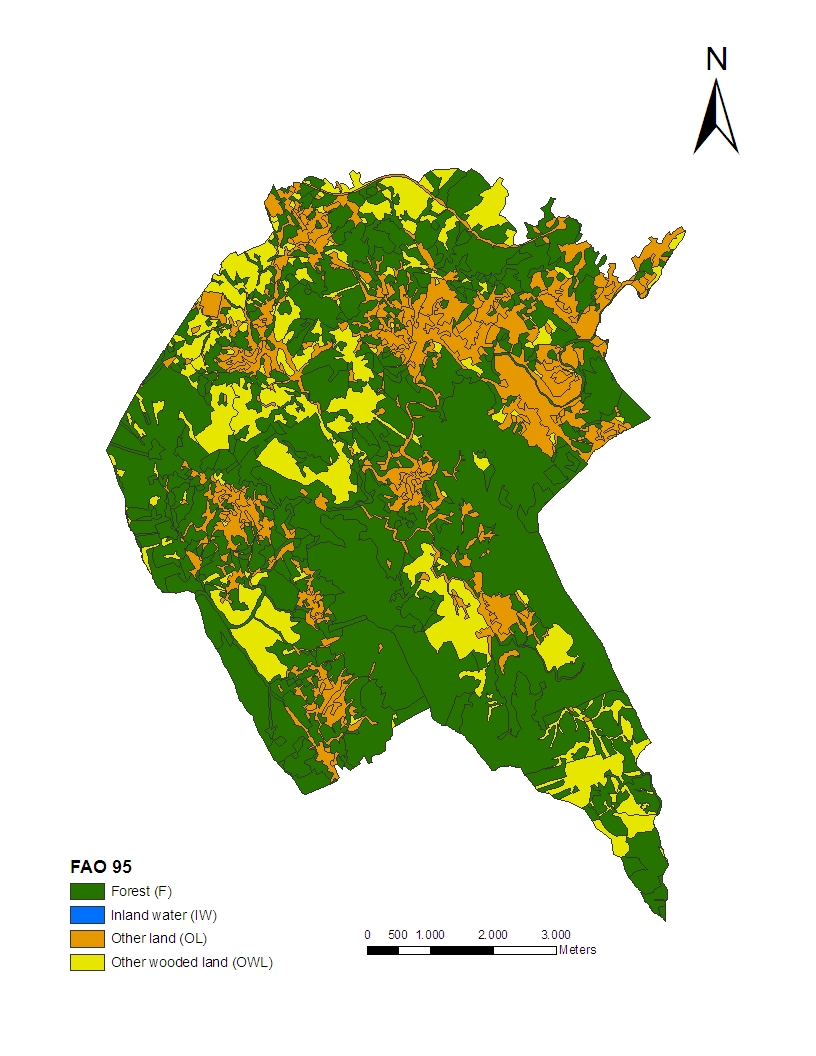
Comparison of the forest area mapped according to the FAO and NFI land use classification in 1990 and 1995
Data sources :
1990: COS 90, produced by IGP, Portuguese Geographic Institute (Instituto Geográfico Português), through the interpretation of aerial photographs 1:15 000, taken in August of 1990 and August of 1991. (http://snig.igeo.pt/cgibin/snig/Igd/importacao.cgi?cod=C471; 10 April, 2007)
1995: Aerial photograph 1:40 000, ortorectified. Photo interpretation done by AFVS staff.
Remarks
Comparing the FAO and the Portuguese NFI classification the similarities and the differences are the following:
a)Similarities:
“Forest”: the same concept in both;
“Other wooded land” in FAO the same as “uncultivated land” in Portuguese NFI.
b) Differences:
- “Other land”: in FAO classification is disaggregated in three classes of Portuguese NFI: “Agricultural land”, “Social land” and “Unproductive land”.
For the mapped area, the table above shows that forest area increased between 1990 and 1995.
Even though there is yet no mapping available for the 2005 NFI, the preliminary results already announced by the Forest Services show a decrease of forest area between 1995 and 2005 in the Sousa Valley.
There are methodological differences between COS 90 and the photo interpretation of the 1995 NFI. These differences refer to the minimum geographical area considered as “Forest”:
a)COS 90: minimum surface of 0,2 ha and a minimum width of 15 m;
b)NFI 1995 photo interpretation: minimum surface of 0,5 ha and a minimum width of 20 m.
The FORSEE team attempted to do a simple correction on the data for these differences. These corrected data are reported in the table. The cost of those corrections is included in the cost of map analysis.
Problems and improvements
It was proposed to analyze the land use evolution at the pilot zone over the years 1990, 1995 and 2005 according to FAO definitions. The objective was to identify the new forest areas and the reforested areas taking into account the area that would be considered by Kyoto protocol for carbon stock change estimation. Another objective would be to predict future carbon stocks under alternative land use and management by the construction of different scenarios.
However, it would be necessary to have the land use classes and area for 1990, obtained through the interpretation of the aerial photograph of 1990, the land use classes and area for 1995 obtained through the interpretation of the aerial photograph of 1995 and the land use classes and area for 2005 obtained through the interpretation of the aerial photograph for 2005, all done with the same parameters. The aerial photograph of the 2005 NFI are not available yet. For 1990 what should have been done was the photo interpretation of the aerial photographs ordered by ACEL in 1990. ACEL was the Association of the Enterprises Producers of Cellulose’s Pulp (Associação das Empresas Produtoras de Pasta de Celulose) that together with FAPEL, Portuguese Association of Paper and Cardboard Producers (Associação Portuguesa de Fabricantes de Papel e Cartão) formed CELPA, the Association of Paper Industry (Associação da Indústria Papeleira), in 1993. The aerial photographs covering the 6 municipalities of Sousa Valley were lost, or at least, they could not be found by the institution which was supposed to keep them. Therefore, the project team had to rely on the COS 90 which is a map of land use done by IGP, Portuguese Geographic Institute (Instituto Geográfico Português) based on photos taken in August of 1990 and August of 1991.The shortcomings of this approach is that there, the methodology used for COS 90 is not the best one for forest inventory purposes.
Another shortcoming is that this indicator does not cover the whole pilot zone. The territory covered is part of the area for which the photo interpretation of the 1995 NFI was already done by AFVS staff. From this area, one mapped here the one where the 35 plots measured under FORSEE project to evaluate C1 and C2 indicators were implemented.
So, the main stumbling block concerning the implementation of this indicator in the pilot zone is not so much the changes in methodologies and the reconciliation of the Portuguese NFI and the FAO classifications but the timely availability of the primary data that is needed here, that is the aerial photographs. So, if improvements can be made for this indicator, they should be done primarily to make those maps easily available.
Comments and conclusions
The relevance of this indicator for sustainable forest management is obvious. The fact that forest area increased from 1990 to 1995 and decreased from 1995 to 2005 shows that this indicator should be monitored very closely and in a time frame shorter that the one used for NFI. This reinforces the recommendation for improving the timely availability of aerial photographs. Capacity for their photo interpretation is available at the local level.
Forest area is not considered by the Criterion 1 of the Portuguese Norm 4406 2003.

Initiative Communaitaire FEDER
INTERREG IIIB Espace Atlantique