Percentage of the total forest area in Sousa Valley: 14,3 %
No of plots: 35
Cost
TOTAL COST:
1227,3 €
Costs/ha: 0,24 €
Costs/plot: 35 €
The total cost includes:
1- Data collection: 959 €
2- Data analysis: 268,3 €
Results
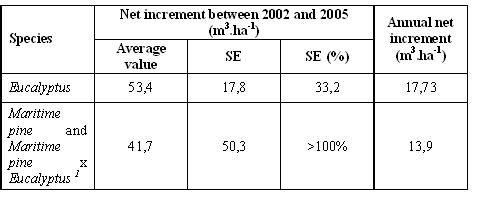
Net increment in Sousa Valley between 2002 and 2005
Volume harvested in Sousa Valley year and per hectare each year
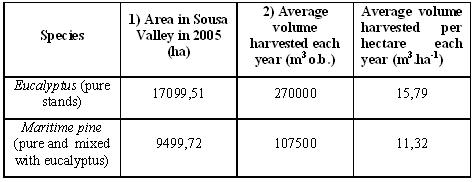
1)Source: IFN 2005;
2)Source: Local foresters working for the pulp and paper industries.
Extraction rate in Sousa Valley per hectare each year
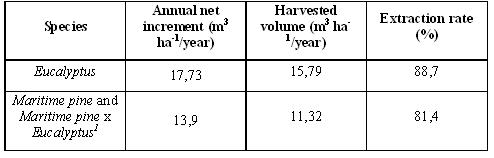
Extraction rate = (volume harvested/net increment)*100
Remarks
Data availability:
a)Net increment: Data came from two forest inventories in the same plots. The first was carried out by AFVS in 2002 during the development of the Pilot Project of Sustainable Forest Management (2001 - 2002). With data collected during the field work carried out in 2002 and the data collected during the field work carried out in 2005 it was calculated the net annual increment per year for the area where the plots were located (South of Paredes) considering a period of 3 years (2002-2005). This net annual increment was considered to be the same in the 6 municipalities of Sousa Valley (Paredes, Penafiel, Paços de Ferreira, Castelo de Paiva, Felgueiras and Lousada).
b)Fellings: Local experts linked with the pulp and paper industries were contacted to provide the volume of wood harvested and marketed per year in the region of Sousa Valley.
According to the tables above, the extraction rate is very high.
Problems and improvements
In order to monitor this indicator it would be needed to accomplish forest inventories in the same plots in regular periods. There are some data limitations that can be affecting the results:
a)The net annual increment was calculated for 35 plots which represents only half of 1 municipality of Sousa Valley;
b)Sampling errors are high, 33,2% for Eucalyptus globulus and >100% for Pinus pinaster;
c)In the calculations, mixed stands of Eucalyptus globulus and Pinus pinaster are considered as pure stands of Pinus pinaster;
d)The volume of wood harvested only covers the volume of wood marketed being these data an gross estimation by local experts.
An improvement to be done is to increase the sampling plots because with 35 plots results obtained for Pinus pinaster are not reliable
Conclusion
The results suggest that forest sustainability in Sousa Valley can be committed given the high rates of extraction (88, 7 % for Eucalyptus globulus and 81, 4 % for Pinus pinaster and Pinus pinaster x Eucalyptus globulus).
These high rates of extraction correspond to the excess of derived demand given the shortness of wood available, very affected by forest fires.
Local experts linked to pulp and paper industries confirm this trend.
There is the necessity of improving and continue the collective organisation and the support of the forest owners in order to have Sustainable Forest Management in Sousa Valley.
Net annual increment of wood is one of the indicators of Criterion 3 considered by NP 4406 2003. NP 4406 2003 considers that the net annual increment is a way to evaluate the average growing rate of the main forest product. It has big influence in the decision of the optimum moment of harvesting.


Initiative Communaitaire FEDER
INTERREG IIIB Espace Atlantique