Costs
TOTAL COST: 681,9 €
The total cost includes:
1- Data collection
181,9 €
2- Data analysis
500 €
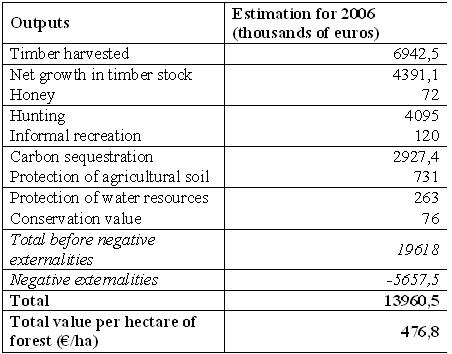
Results
Total economic value of forest production in Sousa Valley
Remarks
To assess this indicator we took advantage of the work on the MCPFE indicators for the FORSEE project.
Only a partial estimation of TEV was attempted in the FORSEE project.
The scope of this estimation is the economic valuation of the outputs of forests in Sousa Valley region for 2006, including those that are not marketed. Some of these outputs contribute positively to the society's well being and are therefore referred to as social benefits, while others contribute negatively, being referred to as social costs. This study is mainly concerned with the ‘resources’ side of a forestry production account (in the regional accounting sense of the word), extended to include some forest public goods and other non-marketed forest goods and services (Bergen, 2001). Estimates of some of the ‘uses’ in the forestry production account are given only for the depreciation in forestry capital due to fires. Therefore, a complete estimate of the net social added value for forestry is not obtained.
We will also not attempt to analyse whether or not society uses of forest outputs are above or below sustainable levels. So we leave out capital gains.
We will not attempt to deal with the outputs of agro-forestry systems since they are not important in the Sousa Valley. This does not mean that we will restrict our attention to timber production only. Besides timber production we will also look at non wood forest goods and services (marketed, marketable and non marketable), like services provided by forests due to the action of the public sector, and some environmental services which are public goods. Timber is evaluated at stumpage prices.
Estimates
DIRECT USE VALUES – Wood forest products
Timber harvested
Data regarding the production of the different types of timber harvested is provided by local sources (direct communication of foresters working for enterprises buying timber in Sousa Valley). This data come in cubic meters over bark. Monetary valuation is based on stumpage prices for 2006 (local sources) considering that the price for different types of destination of the main forest species occurring in Sousa Valley: Eucalyptus and Maritime pine.
Estimates for 2006:
–Eucalyptus
Pulpwood: 170000 m3 ob X 17,5 €/m3 ob = 2975000 €
Sawnwood: 70000 m3 ob X 22,5 €/m3 ob = 1575000 €
Fuelwood: 30000 m3 ob X 5 €/m3 ob = 150000 €
4700000 €
–Maritime pine
Pulpwood: 30000 m3 ob X 9 €/m3 ob = 270000 €
Sawnwood: 60000 m3 ob X 30 €/m3 ob = 1800000 €
Panels:10000 m3 ob X 13,5 €/m3 ob = 135000 €
Fuelwood: 7500 m3 ob X 5 €/m3 ob = 37500 €
2242500 €
TOTAL: 377500 m3 ob X 18,4 €/m3 ob =6942500 €
Net growth in timber stock
Physical valuation considers the difference between the annual forest increment and the timber harvested. With data collected in the field during the development of a project carried out by the local FOA (AFVS) between 2001-2003 and data collected in the field during the development of FORSEE project (in 2005) it was possible to determine the net increment between 2002 and 2005 for half of the municipality of Paredes, where the 35 FORSEE plots are located.
Monetary valuation is based on half of the stumpage price for saw logs, considering that not all the annual variation is based on half of the net growth in timber stock has an exchange value. This valuation does not include the annual variation in the value of timber stock as a carbon sink, which is a public good. The latter is incorporated in the value of the forest environmental services.
The stumpage prices are the price of Maritime pine and for Eucalyptus (local sources, 2006).
Net grow in timber stock
Estimates for 2006:
TOTAL: 15 m3 ob / ha year X 29274 ha X 10 €/m3 = 4391100 €
DIRECT USE VALUES – Non wood forest products
Honey
Data for the number of beehives in the 6 municipalities of Sousa Valley was given by the National Agricultural Censuses (INE 2000) and the Regional Direction of Agriculture of Entre-Douro e Minho (DRAEM), settled in Penafiel. The productivity of each beehive was given by local producers as well as the price paid to the honey producers by middle men.
According to local sources almost all the production is sold to middle men but there is one part sold directly to local consumers and other for own consumption. The price of honey paid by local consumers is higher than the price paid by middle men but the estimation considers that the price paid to the producers is the price paid by middle men.
The total number of beehives in Sousa Valley is 2418, the price paid by middle men to honey producers is 1,5 €and the productivity of honey per beehive in Sousa Valley is 20 kg.
Estimates for (2006):
TOTAL: 2400 beehives X 20 kg/bee-hive X 1,5 €/kg = 72000 €
Hunting
In Portugal, hunting rights can be used under two different and mutually exclusive regimes: the “general” regime and the “special regime”. The special regime corresponds to different forms of management of gaming resources (public, associative and private) appealing to excludability mechanisms in order to prevent overexploitation. Associations of hunters manage most of the land under special regime. These associations own and rent land for the purpose of managing gaming resources whose access will be restricted to the members of the association. The other major form of special regime corresponds to the tourist hunting zones which are private lands managed for gaming by private firms selling access to hunting and related services.
The general regime covers the rest of the territory where hunting is allowed to everyone who has a permit issued by the Ministry of Agriculture. In this regime game is “collected” by hunters, but is not actively managed by them. As the special regime expands, the territory for the general regime shrinks, leading to conflicts between the hunters in the two regimes.
In Sousa Valley there are 15 associations and clubs of hunters, 9 of them managing zones of hunting created by the municipalities, and 1 private hunting zone. Data on the number of hunters in Sousa Valley is an average of the values given by the hunters inquired.
Hunting
Estimates for 2006:
TOTAL: 3000 hunters X 1365 €/hunter = 4095000 €
- Annual costs per hunter:
a) Hunting permit: 24,94 €
b) Dog permits: 3 dogs x 20 €/dog = 60 €
c) Membership fees for hunting clubs: 20 €
d) Insurance: 30 €
e) Dog FOAd: 500 €
f) Outfit and ammunitions: 300 €
g) 20 days in municipal hunting areas X 5 €/day = 100 €
h) Travel costs: 20 days X 50 km/day X 0,33 €/km = 330 €
- Total per hunter and per year: 1365 €
Recreational services - Informal recreation
No data are available regarding the number of visits to forests and other wooded lands for recreational purposes. Therefore, the number of sites frequently visited in Sousa Valley is 8 and the number of sites moderately visited is 14. It was considered that in places frequently visited there are 200 visitors per weekend and in places occasionally visited 100 visitors per weekend. The visits must happen the weekends with good weather that must be around 40 per year. The willingness to pay for this type of recreation is supposed to be 1€.
The number of sites was given by the foresters working at the technical offices of the municipalities as well as the frequency of use.
Estimates:
- 8 recreation sites very visited X 40 weekends X 200 visitors-weekend X 1 €/visitor = 64000 €
- 14 recreation sites moderately visited X 40 weekends X 100 visitors-weekend X 1 €/visitor = 56000 €
TOTAL: 64000 € + 56000 € = 120000 €
INDIRECT USE VALUES
Carbon sequestration
The net annual increment of carbon storage in the woody biomass of Sousa Valley Forests amounts 5tC/ha year based on the estimative done by T. Fonseca (2006). If this flow is evaluated at the mean social cost of carbon emissions of 20 €/tC as estimated Fankhauser (1995, p.84) for the decade 1991-2000 an estimate of 2927400 € is obtained.
Estimates (2002 – 2005):
TOTAL: 5 tC/ha year X 29274 ha X 20 €/tC = 2927400 €
Agricultural soil protection:
Estimating the protection of agricultural land begins with the regions facing a higher risk of desertification such as Trás-os-Montes, Beira Interior and Alentejo, where the annual erosion of agricultural soil is 5-10 t/ha (Poeira et al., 1990). In Minho, where Sousa Valley is located, the risk of desertification is lower and the annual erosion of agricultural soil under 5-10 t/ha. One considered 1, 5 t/ha as the annual erosion of agricultural soil in Sousa Valley.
Considering an apparent specific weight for sediments of 1,5t/m3 and a depth of 30 cm for agricultural soils, this erosion corresponds to an annual rate of loss soil of 0,0033%.
Based on Rocha et al.(1986), the ratio of erosion between land with forest cover to land without is 2/3. Assuming this is proportional to the forests’ contribution in reducing erosion, the value of the crops preserved due to soil protection by forest cover is equal to [(1-1/3)/(1/3)] X 0,033% X Value added of farm production. The gross value of farm production in Sousa Valley is 1500 €/ha x 23499,32 ha of agricultural land (NFI, 2005)= 35248980 €. (28039 ha, NFI 1995)
If the (avoided) losses of crops were irreversible, for a 2% discount rate, the value of 29076,9 € would correspond to a capital loss avoided of 1163216,34 €. If an amount of losses equal to v lasts for n years, the corresponding capital loss Vn is given by the following expression:
= v [1-(1+r)-n/r]
Considering a period of 50 years to recover from soil losses due to erosion and a 2% discount rate, the annual value of losses avoided in Sousa Valley is 731048,8 €.
Estimates:
- Annual erosion: 1,5 t/ha
- Apparent specific weight of sediments: 1,5t/m3
- Soil depth: 30 cm
- Annual rate of soil loss: = [(1,5 t/ha)/(1,5 t/m3)]/(10000 m2 X 0,3 m) = 0,033%
- Ratio of erosion with forest to erosion without forest: 1/3
- Value of farm production preserved due to forest cover = [(1-1/3)/(1/3)] X 0,033% X Value added of farm production = 0,066% X (1500 €/ha) X 23499,32 ha = 23264,32 €
- Agricultural capital loss avoided at 2% discount rate:
a) Perpetuity (irreversible loss): 23264,32 € / 2% = 1163216,34 €
b) Annuity (eroded land recovered in 50 years): 23264,32 € X {[1-(1+0,02)-50] / 0,02}= 731048,8€
Protection of water resources:
The protection of water resources is estimated by using the public costs of watershed management avoided by the existence of forests. These costs are considered as a lower bound for forests’ benefits in water conservation. The Management Plans for the main watershed basins (Instituto Nacional da Água, 2000) provide data for the public costs planned for 2001-2020. They relate to the protection of ecosystems (PO3), flood prevention (PO4) and water management (PO6). To estimate the costs that would be borne in the absence of forest, it was assumed that the watershed management costs would increase in the same proportion as erosion would increase without forest cover. Based on data from the 1995 Forest Inventory and data taken from the work of Rocha et al. (1986) on soil erosion, Mendes (2005) reached a value of protection of water resources for 2001 and for Continental Portugal of 28,9 million €. Dividing this value for the area of forest in Continental Portugal one obtained a value of about 8,62 €/ha. Multiplying this value corrected for inflation by the area of forest in Sousa Valley in 2005 gives an amount of about 263000 €.
Estimates:
29274 ha X 9 €/ha = 263000 €
Conservation value (areas with ecological interest):
The estimated value of forest landscape and biodiversity is based on the only study available in Portugal (Santos, 1997). Using CVM, Santos estimated the willingness to pay of visitors to the Peneda Gerês National Park for three different programmes of rural landscape conservation, one of which dealt with oak forest conservation. The best point estimate he obtained for the year 1996 amounted 6634 escudos (33, 090 €/ha) per household and per year and an aggregate willingness to pay of 397, 377 million escudos per year (1,982 million of €/year), based on the total number of households visiting the park between September 1995 and August 1996 (Santos, 1997, p.590). Dividing the aggregated benefit by an estimated surface of forest and other wooded land in Peneda-Gerês National Park, Mendes (2005) obtained a conservation value of 6623 escudos/ha (33, 0353 €/ha). Considering that in Sousa Valley the forest with conservation value are the pure and mixed stands of broadleaves which represents about 8,7 % of the total forest in Sousa Valley (IFN, 2005) and considering that the willingness to pay of the visitors of Sousa Valley forests is 3 € less than the willingness to pay in Peneda-Gerês National Park one obtained:
Estimates:
8,7% X 29274 ha X 30 €/ha = 76405,14 €
Negative externalities of forest fires
The costs of most of the forest fires in Portugal may be considered as negative externalities borne by the forest owners and other people in society who share those costs with them.
a) Costs of forest fire prevention: There are 5 main stakeholders in the forest fire prevention system, the NIPFO, the pulp and paper companies, the Ministry of the Interior, the Ministry of Agriculture and the municipalities.
In recent years, the pulp and paper industries spent between 20 € and 25 €/ha in fire prevention (verbal communication). In Sousa Valley these industries manage about 4908 ha of forest which means that in 2006 they spent about 22,5 € x 4908 ha = 110430 € in Sousa Valley in operations of fire prevention.
In 2006 the Ministry of Interior spent about 70 000 € in transfers to the local forest owner association to co-fund the 2 brigades of forest sappers under its management. This co-funding represents about 50% of the total operating costs of those brigades.
In 2005-2006 the Ministry of Agriculture transferred about 636373, 72 € of funds to the 6 municipalities of Sousa Valley to develop strategic actions for fire prevention through the Forest Permanent Fund (Fundo Florestal Permanente).
In 2006 the Ministry of Agriculture also spent money with the maintenance of the 4 surveillance towers that exist in Sousa Valley. These towers are active during the months of higher risk of forest fire, usually the months of June, July, August and September. Each tower of surveillance has 4 people working by turns of 8 hours earning about 600 Euros/month. This makes a total of 9600 €.
Adding these components one get a total of 826403,72 €.
a)Social costs of fire fighting
There are three main stakeholders involved in fire fighting: the Ministry of the Interior, the local fire departments and the pulp and paper companies.
The calculation of the opportunity cost of the time spent by voluntary fire fighters is based on the number of fires - according to DGF, 150 big fires plus 1400 small fires in 2006 in Sousa Valley - and the assumption of 20 firemen per small fire, each contributing 1 day of work per fire and 40 firemen per big fire, each contributing 3 days of work per fire. Other assumption is that each fireman would earn the minimum wage if working as a full-time employee. In Portugal the minimum wage in 2006 was 385,9 € which means that they would earn about 17,5 €/day. Therefore, the opportunity cost of the time spent in fire fighting in Sousa Valley amounts about 805000 €.
b)Costs losses in wood and non wood forest production
For 2006, estimates wood production losses at about 675 €/ha.
c)Costs of the restoration of burnt forests
DGF estimates the area of burnt forests in Sousa Valley at about 1500 ha in 2006. Reforestation through new plantations would cost around 1350 €/ha.
Estimates for 2006:
- Fire prevention: 800000 €
- Fire fighting: 600 €/ha of burnt forest X 1500 ha = 900000 €
- Fire fighting (opportunity cost of working days lost):
a) 150 fires (more than 1ha) X 40 fireman X 3 days/fire X 17,5 €/days: 315000 €
b) 1400 small fires (less than 1ha) X 20 fireman X 1 day/fire X 17,5 €/day = 490000 €
- Goods and services lost: 1500 ha X 675 €/ha = 1012500 €
- Reforestation costs: 1500 ha X 1350 €/ha = 2025000 €
TOTAL: 5657500 €
Shortcomings and improvements
The estimates presented here should be taken with care because of their limitations on three counts, at least:
- In some cases, the estimates are based on very fragmentary, shaky data and bold assumptions which we tried always to make as explicit as possible;
- In other cases, there are forest outputs and values which are missing because of a total lack of basic data.
These limitations are due to the fact that, given the constraints and the resources available for this project, no new field work could be undertaken to fill in the gaps in the very scarce empirical literature available. So the estimates presented here should be seen as not much more than a current state of the art in the region, contributing to set the ground for so much work that remains to be done.
In order to have more reliable data on the indicators accessibility for recreation and forest environmental services, more specific studies should be developed.
Some progress in the specification is possible at the regional level combining national and official sources with local expertise.
In terms of future work there is a need for more specific studies on recreation, hunting and on the evaluation of forest environmental services.
Comments and conclusion
It is important to estimate the economic value of non wood forest goods and services, as well as the value of environmental services, in order to have a basis on which to establish the sharing of the costs of SFM between the forest owners and the rest of the society.
- Some progress in the specification is possible at the regional level combining national and official sources with local expertise;
- Feasibility conditions for these indicators in Portugal will improve in the future, as more private forestry will go under associative forms of management;
- The existence of a local organization involved in forest management (forest owners’ association) is essential for the feasibility and utility of these indicators;
- Partnerships between these local organizations and research organizations is also essential for the feasibility of these indicators;
- Work on the 6 MCPFE criteria indicators can be useful to calculate a partial estimation of the TEV of forest production;
- To develop this estimations additional specific studies are needed in the valuation of recreation, hunting and environmental services.

Initiative Communaitaire FEDER
INTERREG IIIB Espace Atlantique